Home > mini projects > PULSE WIDTH MODULATION
PULSE WIDTH MODULATION
Abstract -Pulse width modulation (PWM) is one of the techniques through which you can transmit a message signal in the form of pulses. The pulses generated through this technique have different widths. These varying widths of pulses are used in switching electrical and electronic circuits. This project utilizes this feature of PWM in applying the brakes of a car i.e., when the distance between a car and a vehicle is less brakes are applied automatically and vice versa.
Keywords-PWM, sawtooth waveform generator, beam angle,
I. Introduction
There are many modulation techniques to modulate a message signal. They are classified based on few fundamental parameters of message signal. They are amplitude, frequency and phase characteristics of a given signal. The respective modulation techniques are named as amplitude modulation, frequency modulation and phase modulation. Our topic of concern i.e. pulse width modulation is based on the amplitude characteristics of the message signal (input).
II. working of pwm
A. Saw tooth wave generation:
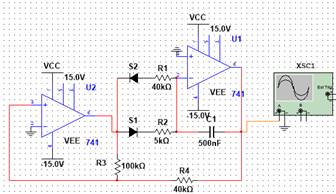
In this process, initially a triangular wave or a saw tooth waveform is generated from an oscillator made of op amps. Generally, to get the output pulses of varied widths the frequency of oscillations of these sawtooth wave is supposed to be nearly 10times higher than the input signal's frequency. As the amplitude of input signal keeps varying, the amplitude of saw tooth wave is chosen appropriately. The frequency of oscillations is given by a formula
Fosc = R3 / (2*C*R4 *(R1+R 2))
R1=5kΩ R2=40kΩ R3=100kΩ R4=40k Ω C=5uF
After calculations, Fosc=11.11Hz
B. Comparison of waveforms:
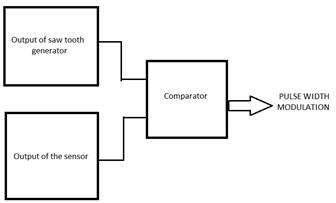
The saw tooth wave generated from the oscillator circuit is fed to the positive terminal of the comparator and the input to be compared with this is fed to the negative terminal of the comparator. When the amplitude of input is higher than that of the saw tooth waveform's the output given by the comparator is -Vsat otherwise +Vsat.
Circuit diagram of saw tooth wave generator:
Block diagram:
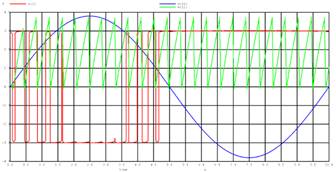
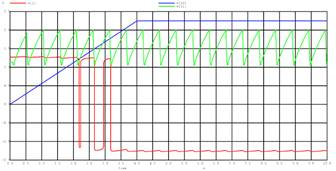
Output of PWM:
Input- sinusoidal signal-Blue colour ; sawtooth waveform-Green colour ; PWM-Red colour
III. pwm application
Controlling the velocity of a car based on its relative distance with another vehicle/obstacle:
The task that we are concerned is to control the velocity of a car. As most of the youngsters feel thrilled when they move with greater speeds, they end up with committing accidents. This can be put to check if the speed is properly maintained. In other words, if the brake mechanism is automated this can be achieved.
Block diagram:
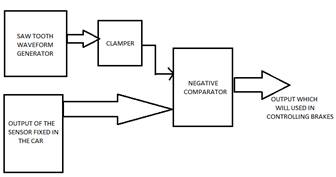
In order to do this, we will be putting up a sensor in front part of a car. This sensor generally projects ultra-sonic waves radially and calculates the distance between the two vehicles depending on the time of flight of the waves. Time of flight here means the time taken by the waves to hit any object and return to the sensor again. Depending on the time of flight, sensor provides different voltage levels as an output. The sensor gives a bit higher voltage when two vehicles are closer and a bit lower voltage when they are far away from each other.
Details of the sensor:
MB1260CL-maxsonarezlo high performance ultrasonic range finder. It operates at a voltage ranging from 3.3V to 5V. It produces an output of 4.49mV for every two centimeters of distance between the two vehicles. If the input voltage provided to it is 3.3V then it sources a voltage of 3.2mV for every 2cm.So the task ahead of us is now to set proper amplitude to the saw tooth waveform. If proper value is not chosen it leads to improper functioning of the circuit.
Sensor's behavior with respect to distance-Blue (practical):
(PWM-Red coloured signal, Sawtooth Waveform-Green coloured signal)
This output from the sensor is fed to the input of the PWM circuit. Now when the 2 objects are closer the sensor provides higher voltage and PWM circuit sources pulses of greater widths which in turn can be used as a source to apply brakes. Closer the cars, greater is the time that brakes get applied. If the vehicles are far away, then the sensor sources lower voltage. The PWM circuit then sources pulses of widths with higher off time. This implies that the brakes are applied rarely.
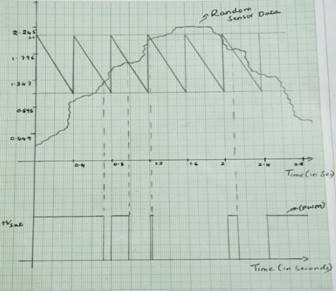
Behavior of the circuit when sensor is connected:
Calculation of amplitude of the saw tooth waveform:
Step1: As the minimum voltage given by sensor is 2.245mV for every 1cm, we need to shift (clamp) the sawtooth waveform above the zero level.
Step 2: When the distance between two vehicles is less than 5m, then the brakes should be applied irrespective of the vehicle's speed. It is so considered because, even if the vehicle is moving at its highest speed, it requires 5m to make sure that the vehicle comes under control and no one gets harmed. So, when the distance between the vehicles is 5m sensor sources a voltage of 1.1225V. So, the lower threshold of the saw tooth waveform would be 1.1225V. This implies that the vehicle stops when the distance between them is less than 5m
Step 3: The maximum voltage that a sensor can source is 2.245V and the maximum distance it can sense is also 10m.So the upper threshold voltage for the saw tooth waveform is 2.245V.But we have considered it as 2.1V as the sensor continuously provides 2.245V even when there is no vehicle moving ahead of us. Finally, the upper threshold voltage is 2.1V
Step 4: Now as we are done with the voltage levels, the next problem to be solved is to clamp the saw tooth waveform such that the peak to peak voltage is nearly 1V. For this we have reduced the dc supply given to the op amp so that the total output swing of saw tooth waveform comes down to 1v.
The dc supply for which we were able to obtain the desired waveform is 1.3V. By using a clamper circuit, we were able to clamp this waveform between 1.125V and 2.1V.
IV. pwm application(ii)
Switching of lights based on the intensity of light in a room:
The next task that we are going to deal with is the power consumption and automation of lights in a hall of larger area. Now a days we are running short of nonrenewable sources. So, the necessity to save power is increasing day by day. Though there is enough sunlight, we switch on lights during day time by closing the windows. There might be relative darkness at the center of a hall when compared to the extremes which are at the windows. So, if we can switch on lights wherever necessary then we can save a lot of power. For example, in educational institutions there will be bigger classrooms with proper ventilations, so if we could implement this idea there we can save considerable amount of energy as there are hundreds of educational institutions in a city.
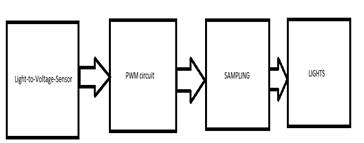
The first stage of block diagram consists of light to voltage sensor. This sensor detects the intensity of light present and accordingly generates different voltages. The output of this sensor is fed to the input terminal of the PWM circuit. Then PWM circuit generates pulses of different widths accordingly. This output is then given to a sampler circuit. Here we initially calculate the light intensities and the corresponding pulses generated by PWM circuit. From those calculations, we get an idea about the time required to sample the pulse waveform so that the sampled outputs are sent to different lights. This idea would be clear on seeing the graph at the end of this page.
Block Diagram:
Sensor characteristics with respect to light intensity:
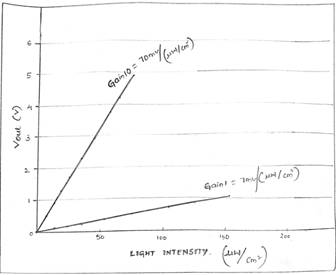
These are the characteristics of MLX75305sensor.From the graph it is clear that the sensor sources output voltage which increases linearly with the intensity of light.
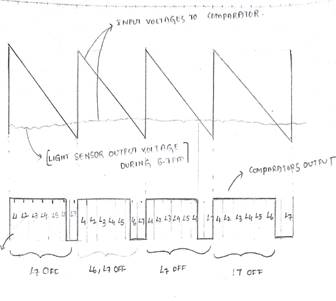
The graph shown above considers a data of the sensor during 6-7pm in the evening. As the intensity of light will be less the voltage generated by the sensor will also be less and accordingly pulses of different widths are generated on comparing it with saw tooth wave form. Now we will divide this waveform into the number of lights available. We have considered that there are 7 lights to be operated, so there are 7-time slots in the graph. Each time slot is divided based on the time period of the saw tooth waveform. Generally, the signal is sampled at the midpoint of each time slot. The sampled value available after sampling in a particular time slot will always be dedicated to one particular switch of light.
CONCLUSION:
By applying the concept of PWM , we have designed a brake system such that the vehicle halts if it is at a distance less than 5m from another vehicle and it slows down if it is at distance less than 10m.If this system is put into use it increases the lifetime of the engine and also may prevent some accidents from occurring that are due to negligence of the driver. Using the same concept, we have also proposed another idea to save the power by utilizing sunlight efficiently (wherever there is proper ventilation).