Home > mini projects > Digital Thermometer using 1N4148 Diode
Digital Thermometer using 1N4148 Diode
Abstract - In today ' s world, there is a huge demand for cost-effective and portable thermometers. These thermometers are mainly used for domestic and medical purposes. In this project, we propose a compact and portable design of a digital thermometer for such domestic and medical uses. We have used 1N4148 diode as a temperature sensor and Ngspice as a tool for simulation. The temperature coefficient of the diode, -2 mV/°C is exploited for this application to create an accurate digital thermometer. 1N4148 is able to operate as a temperature sensor in the range 0 ℃ to 160 ℃. The diode is connected as feedback to an operation amplifier (IC 741), whose output voltage will be a function of temperature. This output voltage will be further amplified by a second operational amplifier and presented as input to an Analog to Digital Converter(ADC). If this thermometer is used in daily life, a digital multimeter/LCD unit will be interfaced to view the reading.
The goal of this project is to propose a device which will combine both these capabilities simultaneously.
In the circuit designed, operational amplifier IC1 (IC 741) provides a constant flow of current through the 1N4148 fast signal silicon diode. The steady state response and the dynamic response of the diode are used to support this statement. The variation in temperature causes the voltage drop across the diode to change. This change must be linear, in order to get reliable results. The output voltage of this IC1 is thus a function of voltage variation across the diode, which in turn is a function of temperature. This output is amplified by second operational amplifier IC2. Preset RV1 is used to set the zero-reading on the meter and preset RV2 is used to set the range of temperature measurement.
I. INTRODUCTION
T HE use of p-n junction characteristics for the design of systems which employ temperature measurement has been done by many researchers. The most prominent among them is Ocaya [1], who established the linear temperature-voltage relationship for temperature ranges of 0 °C to 100 °C in a p-n diode, while describing its voltage, current and temperature behaviour. It was also demonstrated by Godwin [2] that the 1N4148 diode has linear voltage variations with temperature in the range −40 °C to 150 °C. The value of the thermal time constant for the diode(1N4148) was found out to be 390 milliseconds. Maximum leakage for both types at 150°C is 50 µA at -20V. The property of voltage-temperature relation being linear in temperature range −40 °C to 150°C is being extrapolated to make a digital thermometer. The critical requirement of today's world is to have an easily portable temperature sensing instrument, fitted with a convenient display unit, for measuring room and body temperature. Most of the temperature measuring instruments available today are either resistance temperature detectors (RTD), thermocouple digital, or thermistor digital thermometers. The dynamic responses of both diode and a thermocouple was carried out and it was found that diode had a larger thermal time constant than thermocouple. Most of these require a current sensing device either for calibration, or for measuring purposes.
|
Output of |
ADC |
Display |
||
|
Simulated |
||||
|
Unit |
||||
|
Circuit |
||||
![]()
![]()
Fig.1. Block Diagram I
The expected output voltage range of IC2 op-amp is 0-5 V. This voltage can be given as input to an n-bit Analog to Digital Converter (ADC) which will produce an n-bit digital equivalent corresponding to this voltage. This digital output can be fed to an integrated display unit, or to an LCD / 7-segment display interfaced using embedded systems. [Fig.1.].
|
Output of |
Voltage |
Multimeter |
||
|
Simulated |
scaler and |
|||
|
(mV) |
||||
|
Circuit |
shifter |
|||
![]()
![]()
Fig.2. Block Diagram II
Our circuit has one more additional flexibility. Rather than using a separate display unit for displaying the temperature value, the output voltage can be specifically level-shifted and/or scaled so that the numerical value of that scaled voltage in mV is equal to temperature in °C. [Fig.2.].
Before the hardware implementation of any proposed design, it must be simulated first in software, and checked if it meets our desired specifications or not, whether it gives expected output or not. Based on these results, further course of action will be decided. This project implements the digital thermometer model using Ngspice. Ngspice is a mixed-signal circuit simulator. Spice was originally written at The University of California at Berkeley (USA).To write a Ngspice code, the circuit must first be drawn on project, and all its nodes must be numbered. Then following the syntax as mentioned on Ngspice manual, the components must be included and connected across the nodes. Ngspice implements various elements, like resistors, capacitors, inductors (single or mutual) transmission lines and a number of semiconductor devices like diodes, bipolar transistors, MOSFETs (both bulk and SOI), MESFETs, JFETs and HFETs. Ngspice supports five types of analyses viz. transient, dc, ac, transfer and operating point. Transient analysis includes transient noise simulation. AC analysis includes small-signal noise simulation, pole-zero and transfer function analysis.
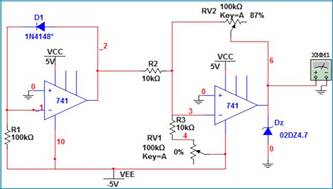
Fig.3. Circuit for simulation in Ngspice
NGSPICE NETLIST FOR DIGITAL THERMOMETER:
A. Op-amp IC 741 subcircuit:
*Op amp sub circuit: DM project*
*Op amp sub circuit: DM project*
.SUBCKT OP741 1 2 3 4 5
*nodes: 3=+ 2=- 1=out 5=V+ 4=V-
*Vcc=15 Vee=-15 CC=3e-011 A=200000 RI=2e+006 *Ro=75 VOS=0.001 IOS=2e-008 IBS=8e-008 *VSW+=14 VSW-=-14 CMRR=90
*ISC=0.025 SR=0.5 Fu=1e+006 Pm=6.09112e-007
VC 5 15 DC 1.68573V
VE 12 4 DC 1.68573V
IEE 10 4 DC 1.516e-005A
R1 10 0 10Gohm
R6 11 0 100Kohm
R7 5 4 1Kohm
Rc1 6 5 5305.16ohm
Rc2 5 7 5305.16ohm
Re1 9 10 1839.19ohm
Re2 8 10 1839.19ohm
Ro1 1 14 37.5ohm
Ro2 14 0 37.5ohm
Ree 10 0 1.31926e+007ohm
Rcc 0 13 2.20906e-005ohm
Cee 0 10 1e-012
Cc 14 11 3e-011
C1 6 7 1e-016
GA 11 0 6 7 0.000188496
GC 0 13 1 0 45268.1
GB 14 0 11 0 282.942
GCM 0 11 10 0 5.96075e-009
D1 14 13 Dopamp1
D2 13 14 Dopamp1
D3 1 15 Dopamp2
D4 12 1 Dopamp2
Qt1 6 2 9 Qopamp1
Qt2 7 3 8 Qopamp2
.MODEL Dopamp1 D (Is=7.53769e-014A Rs=0 Cjo=0F Vj=750mV Tt=0s M=0)
.MODEL Dopamp2 D (Is=8e-016A Rs=0 Cjo=0F Vj=750mV Tt=0s M=0)
.MODEL Qopamp1 NPN(Is=8e-016A BF=83.3333 BR=960m
+ Rb=0ohm Re=0ohm Cjs=0F Cje=0F Cjc=0F
+ Vje=750m Vjc=750m Tf=0 Tr=0 mje=0 mjc=0 VA=50)
.MODEL Qopamp2 NPN (Is=8.30948e-016A BF=107.143 BR=960m
+ Rb=0ohm Re=0ohm Cjs=0F Cje=0F Cjc=0F
+ Vje=750m Vjc=750m Tf=0 Tr=0 mje=0 mjc=0 VA=50)
.ENDS
"
B. Digital Thermometer:
.include opampmulti.cir
.model ZENER D(BV=4.7 IBV=5e-3 RS=40 IS=1e-12 )
.MODEL 1N4148 d (
+ IS=6.89131e-09 RS=0.636257 N=1.82683 EG=1.15805
+ XTI=0.518861 BV=80 IBV=0.0001 CJO=9.99628e-13
+ VJ=0.942987 M=0.727538 FC=0.5 TT=4.33674e-09
+ KF=0 AF=1 TNOM=27)
X1 2 1 0 10 9 741
X2 6 3 0 10 9 741
V1 9 0 dc 5V
V2 10 0 dc -5V
R1 1 10 100k
D1 2 1 1N4148
R2 3 2 10k
RV2 3 6 100k
R3 3 4 10k
RV1 4 10 100k
dz 0 6 zener
.dc temp -200 350 1
.control
run
display
set color0=white
set color1=black
set xbrushwidth=3
plot v(6)
plot v(2,1)
meas dc output_v find V(2,1) at =-50
meas dc output_v find V(2,1) at =0 meas dc output_v find V(2,1) at =25 meas dc output_v find V(2,1) at =50 meas dc output_v find V(2,1) at =75 meas dc output_v find V(2,1) at =100 meas dc output_v find V(2,1) at =125 meas dc output_v find V(2,1) at =150 meas dc output_v find V(2,1) at =175 meas dc output_v find V(2,1) at =200 .endc
.end
C. MATLAB code for plot:
clc
close all
clear all
%% DM Project Voltage-Temperature plot for OPAMP I T=-150:1:200;
L=length(T) for i=1:L
"V(i)=-0.0024913*T(i)+0.4886; end
T=-150:1:200; subplot(1,2,1) plot(T,V,'r'); %plotting 11 data points for i=-50:25:200
hold on; plot(T(151+i),V(151+i),'r*');
end
title('Voltage-Temperature Relationship: Stage I');
xlabel('Temperature');
ylabel('Voltage across Diode');
display(L);
%% STAGE II: OPAMP II
%plotting for linear region from -60 deg to 190 deg C
T1=-60:1:190;
L1=length(T1);
for i=1:L1
V1(i)=0.025024962*T1(i)-0.3212851;
end
T1=-60:1:190;
subplot(1,2,2)
plot(T1,V1,'m');
hold on;
%plotting data points for temp: -57,-50,0,50,100,150,182,200
%-57 deg C is min T and 182 is max Temp plot(T1(4),V1(4),'b*'); hold on;
plot(T1(243),V1(243),'b*');
for i=-50:50:190
hold on;
plot(T1(61+i),V1(61+i),'b*');
end
title('Voltage-Temperature Relationship: Stage II');
xlabel('Temperature');
ylabel('Voltage across Diode');
display(L1);
%% ends
III. RESULTS AND DISCUSSION
The simulation results were recorded and analyzed in Ngspice, and the data was plotted using MATLAB and Microsoft Excel for a better view.
A. Variation of diode drop with Temperature
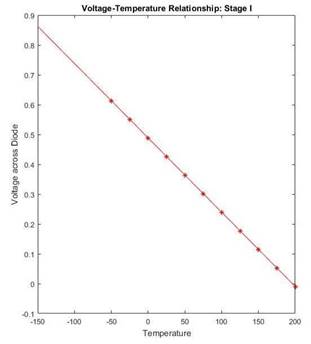
Fig.4. Temperature-voltage relationship in the range -
150°C to +200°C (MATLAB Plot)
Variation of Voltage Drop across Diode
with Temperature
|
1 |
||||||||||||||||
|
0.9 |
y = -0.00249x + 0.4886 |
|||||||||||||||
|
diode |
0.8 |
R² = 0.9999 |
||||||||||||||
|
0.7 |
||||||||||||||||
|
across |
||||||||||||||||
|
0.6 |
||||||||||||||||
|
0.5 |
Voltage |
|||||||||||||||
|
Voltage |
||||||||||||||||
|
0.4 |
||||||||||||||||
|
0.3 |
Linear |
|||||||||||||||
|
0.2 |
||||||||||||||||
|
(Voltage) |
||||||||||||||||
|
0.1 |
||||||||||||||||
|
0 |
||||||||||||||||
|
-200 |
-100 |
0 |
100 |
200 |
||||||||||||
Temperature
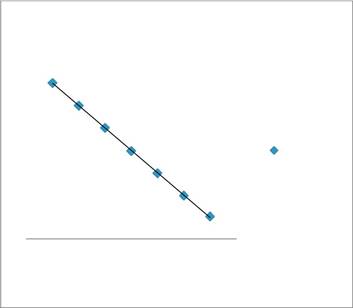
Fig.5. Temperature-voltage relationship in the range -
150°C to +200°C (Excel Plot)
A linear graph of temperature-voltage relationship was obtained. The equation of the graph was found to be
V = -0.00249T + 0.4886, R² = 0.9999
As shown in Fig.5, R² value is very close to unity, showing excellent correlation of the obtained results.
The sensitivity of the diode is
As the output of first op-amp is passed through a second op-amp in inverting mode, hence the temperature-output voltage relationship is also linear, with a positive slope. The equation of the graph was found to be
V=0.02502T - 0.32128, R² = 0.9896
= −2.49 /°
![]()
This result is a characteristic of the 1N4148 diode.
"
B. Variation of Output Voltage with Temperature
As shown in Fig.7, R² value is very close to unity, showing excellent correlation of the obtained results.
The sensitivity of the device is
= 25.02 /°
![]()
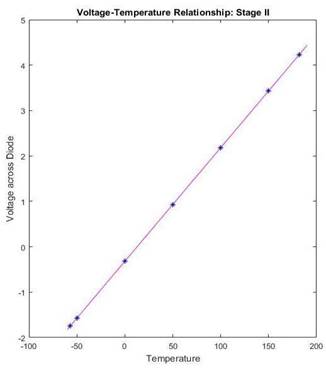
Fig.6. Temperature-Output voltage relationship
(MATLAB Plot)
IV. CONCLUSION
We compare the specifications of the device desired, and those met by the simulated device.
Desired Temperature Range = -50°C to 200°C Desired Output Voltage Range = -2V to 4.5 V
Observed Temperature Range = -57°C to 182°C Observed Output Voltage Range = -1.747 V to 4.23 V
The observed results are very close to the desired results. An unique device incorporating temperature sensing, RTD calibrating and current measuring in the specified range can be fabricated as shown in Block Diagram II [Fig.2.]